
Unlock Global ABM at Scale — Madison Logic strengthens ABM reach with Connected TV and Audio expansion globally. Learn More
Unlock Global ABM at Scale — Madison Logic strengthens ABM reach with Connected TV and Audio expansion globally. Learn More

Account-based marketing (ABM) key performance indicators (KPIs) are crucial for measuring the success of targeted marketing efforts. Your KPIs connect to your campaign’s goals, as they help indicate when buyers are ready to move to the next stage in their buyer’s journey. And now, in what Forrester calls the “buying group era,” we need to understand where buyers are within their decision-making processes at all times.
According to Forrester Research, 94% of B2B buying decisions involve a group of three or more, with each buyer conducting independent research before collectively coming together to make a purchasing decision. Buying committee members are not always moving with the same urgency toward finding solutions for their problems—and many buying committee members may not even realize there’s a problem that needs to be addressed. This disconnect within the buying group only highlights the importance of coordinated efforts in ABM marketing to target and engage decision-makers effectively.
For marketers focusing on high-value accounts, understanding and tracking the right KPIs can make all the difference in aligning marketing and sales teams and driving business growth. This article provides a comprehensive guide on ABM KPIs, helping you optimize your ABM strategy for maximum effectiveness.
Key performance indicators are essential in ABM as they provide measurable data that helps evaluate your marketing strategy’s effectiveness. Tracking the right KPIs enables marketers to:
KPIs are a common language between marketing and sales teams, ensuring that both departments work towards the same objectives. By tracking and analyzing metrics across the sales cycle, teams can make data-driven decisions, adjust strategies in real time, and enhance overall ABM performance.
Implementing account-based marketing into your demand generation strategy successfully requires overcoming several measurement and data analysis challenges. If not addressed properly, these challenges can hinder the effectiveness of your ABM strategy and how you measure success.
With numerous potential metrics and KPIs across demand generation and content marketing, it’s important to focus on those that align with your business goals and provide actionable insights. For example, while some companies prioritize engagement metrics, others focus on pipeline velocity and conversion rates.
ABM involves multiple touchpoints across various platforms and strategies, making integrating data from all these sources challenging. A unified view of your data is essential for accurate measurement and analysis. Tools like customer relationship management (CRM) systems and marketing automation platforms (MAPs) can help streamline data integration, but they require proper configuration and maintenance.
Inconsistent or inaccurate data can lead to misguided decisions and ineffective strategies. Ensuring data accuracy involves regular data cleaning, validation, and standardization processes. This also includes setting up proper tracking mechanisms to consistently capture data across all channels and accurately deliver qualified leads.
Effective B2B marketing requires close collaboration between marketing and sales teams. This is even more important when executing a global account-based marketing strategy.
However, organizational silos can impede this collaboration, leading to misaligned goals and fragmented efforts. Breaking down these silos involves fostering a culture of communication and shared objectives, often supported by integrated tools and regular joint meetings.
Metrics and KPIs both indicate progress toward your departmental and overall company goals. However, there is still a fine distinction between them—yet both are instrumental to tracking your ABM engagement efforts.
KPIs are tied to specific goals, and are meant to measure performance against particular objectives, such as channel performance and how that channel impacts your overall campaign. KPIs also have a specified timeframe to follow (such as a product launch campaign), hence offering a snapshot of what success looks like as it’s clear whether or not you achieved your goal based on your strategic efforts.
Metrics are standardized measurements of specific data points that help you analyze departmental success, such as sales funnel metrics or financial metrics, as well as overall company goals, such as revenue or customer expansion metrics. Think of metrics as informing your overall goals—not as the goal. (For goals, you can look at industry benchmarks and standards to inform what success looks like for your organization.)
Metrics and KPIs work together in that you can link metrics to specific KPIs—but not the other way around. It’s important, then, to understand how you can organize your ABM measurement efforts into different groups that clearly define the relationship between KPIs and metrics, and how both link to a larger goal.
Here are 13 ABM KPIs divided across three groups to consider the main goals of your ABM campaigns: market reach and engagement, pipeline and conversion metrics, and account retention and growth.
Many company attribute marketing’s efforts to top-of-funnel activities, such as brand awareness. But ABM marketers know that they need a unified brand to demand strategy to successfully penetrate and engage every buying committee member across target accounts. These KPIs dig deeper into your reach and engagement to see how your marketing efforts generate demand, which will lead into the next group of metrics you need to analyze.
Market reach evaluates the total potential market size and the percentage of that market you can reach. This KPI is crucial as it helps identify your ABM efforts’ overall scope and potential. By understanding your market reach, you can gauge how well your marketing and sales teams penetrate the market.
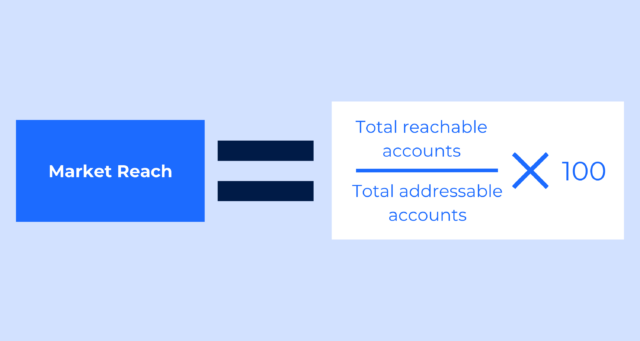
A high market reach indicates that your ABM strategies effectively target and engage the intended audience. If your market reach analysis reveals untapped segments, you might adjust your targeting strategy to include them, potentially expanding your market reach and increasing your addressable audience.
Account engagement measures interactions such as website visits, email opens, and content downloads from target accounts. This KPI indicates the level of interest and engagement from your targeted accounts, helping to assess the effectiveness of your outreach and content strategies.
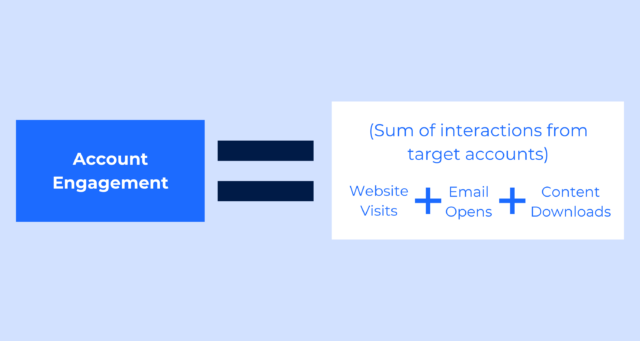
High engagement levels within your ABM program suggest that your content and campaigns resonate well with your audience. If you notice low engagement from a high-priority account, it may prompt you to revise your content strategy or personalize your outreach more effectively to capture their interest.
Audience exposure time tracks the time target accounts spend interacting with your ABM content. This metric reflects the quality and relevance of your content to the audience.
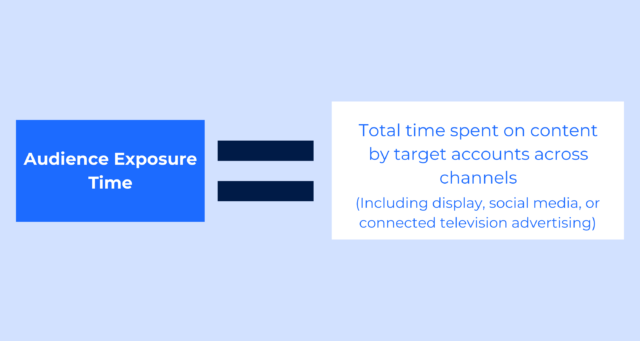
While your industry and platform impact your exposure time benchmarks, the obvious consensus is that longer exposure times typically indicate that your content is engaging and valuable to your audience. If you notice short exposure times, it could indicate that your content isn’t resonating. Revise your content to make it more engaging or informative. Even updating statistics and CTAs will increase the likelihood of retaining your audience’s attention, as they know they’re reading up-to-date industry insights.
Engaged accounts, often referenced as marketing-qualified accounts (MQAs), is the number of accounts showing consistent engagement across multiple decision-makers within a buying group. This KPI helps identify which accounts are most likely to convert and where you should focus your efforts.
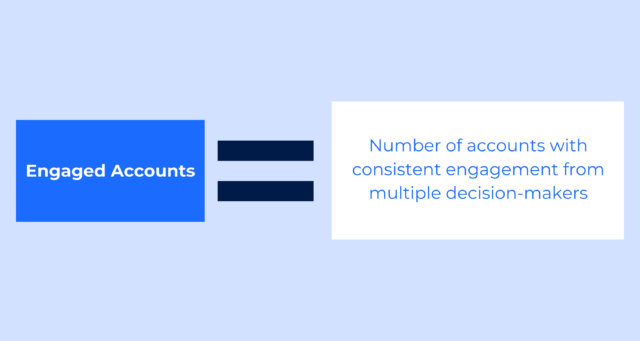
Having multiple decision-makers engaged suggests a deeper penetration of the account and a higher likelihood of conversion beyond just lead generation. If only a single decision-maker engages with your campaign, expanding your outreach based on the level of engagement to other influencers within the account can help increase the likelihood of conversion.
There are hundreds of metrics and KPIs to choose from for pipeline and conversion metrics that highlight sales and marketing’s efforts. You should isolate your marketing efforts to discover how your ABM campaigns contribute to the overall sales funnel. From there, you can dig deeper into cross-collaborative efforts between the marketing and sales team to identify optimization opportunities around any sales enablement materials.
Influenced pipeline creation assesses the value of opportunities created in the pipeline attributed to ABM efforts. This KPI demonstrates the direct impact of ABM on pipeline growth, highlighting how effective your ABM strategies are in generating potential revenue.
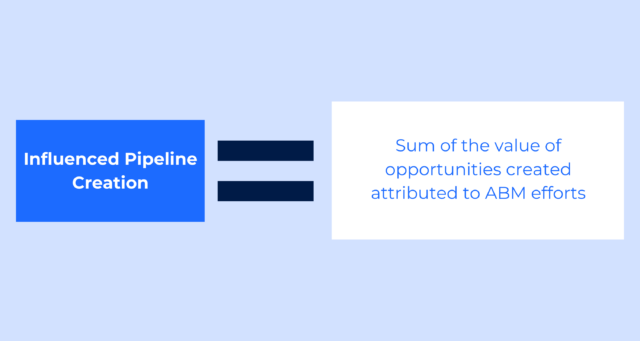
A high influence on pipeline creation signifies that your ABM campaigns are effectively driving pipeline growth. If this metric is low, you might analyze the effectiveness of your current campaigns and adjust messaging or targeting to better resonate with your audience.
Pipeline velocity measures the speed at which opportunities move through the sales pipeline, focusing on the time taken from opportunity creation to closing the deal. This KPI helps evaluate the efficiency of your sales process and identify potential bottlenecks.
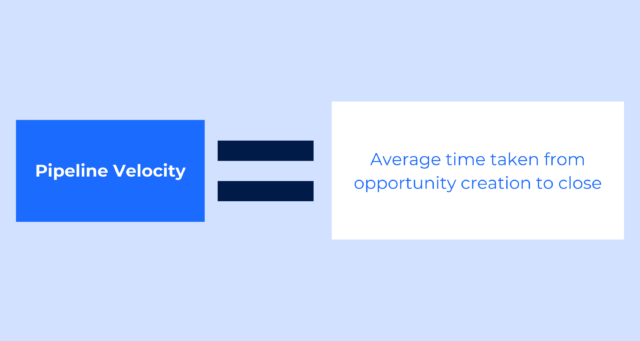
Your industry, company growth stage, and offering play an important role in finding a true benchmark for pipeline velocity, as it depends on how open your marketplace may be in terms of in- and out-of-market buyers. A fast-moving pipeline indicates a smooth and efficient sales process. If you notice a slowdown in a specific sales stage, such as the “proposal” stage, you could provide additional training to your sales team or adjust your strategy to address common objections.
Customer win rate is the percentage of engaged accounts that convert to customers. This metric indicates the effectiveness of your targeting and engagement strategies, providing insight into your ABM campaign’s success.
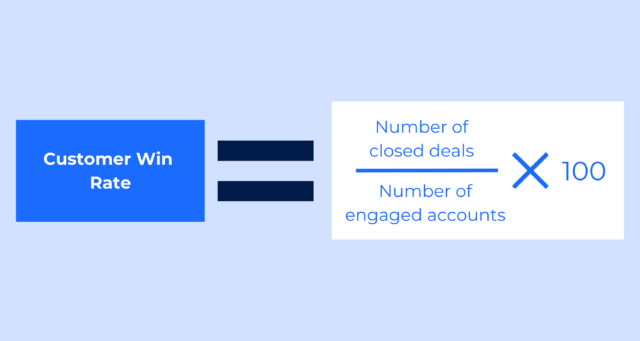
A high win rate suggests that your ABM efforts are successfully converting targeted accounts into customers. A low win rate may prompt a review of your sales process or value proposition to ensure you effectively communicate your offering’s benefits.
Average deal size measures the average value of deals closed with target accounts. This metric highlights the revenue potential of ABM-targeted accounts and can help optimize your targeting strategy.

A larger average deal size indicates successful targeting of high-value accounts. If the average deal size is smaller than expected, you might refine your targeting to focus on larger accounts or enhance your sales approach to upsell higher-value solutions.
If your company isn’t growing, it’s dying—which is why you need to emphasize the importance of growing and retaining existing accounts. It’s a known adage that successfully converting an existing customer to buy more costs five times less than a new account. You need to identify what metrics signal successful expansion and retention, which will lead to deeper insights into customer satisfaction with your services and products.
Retention rate measures the percentage of target accounts retained over time, providing insights into customer satisfaction and long-term value. This metric is crucial for understanding the effectiveness of your ABM efforts in maintaining relationships with high-value accounts.
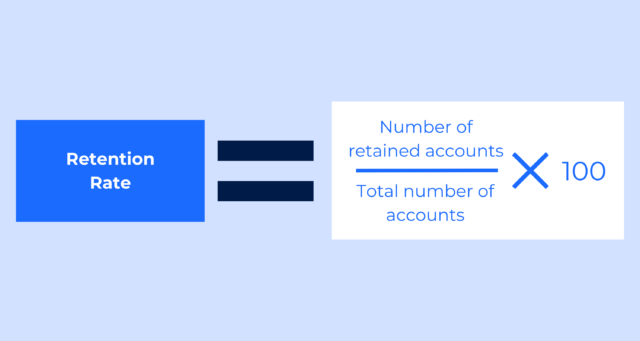
A high retention rate indicates strong customer satisfaction and successful relationship management. If retention rates are declining, it may indicate product satisfaction or customer support issues, prompting a review of your customer success strategies.
Product adoption assesses the extent to which target accounts adopt your products or services. This metric indicates the success of your ABM efforts in driving usage of the overall product or a key module or feature within the product tied to revenue growth or retention, which can inform your product development and marketing strategies.
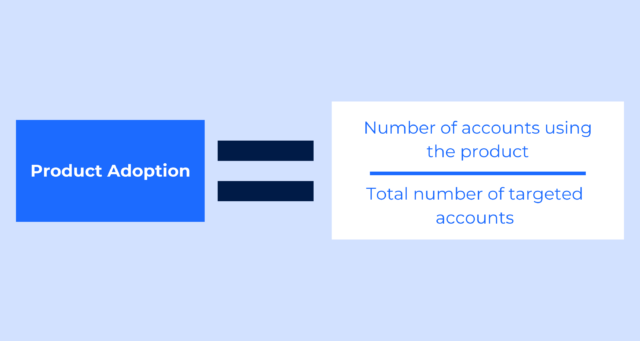
High product adoption rates suggest that your product meets the needs of your target accounts. Low product adoption could lead to an initiative to improve onboarding processes or provide additional training and resources for customers.
Customer upsell rate measures the rate at which existing accounts purchase additional products or services. This metric reflects the success of upselling initiatives and helps identify opportunities for revenue growth.
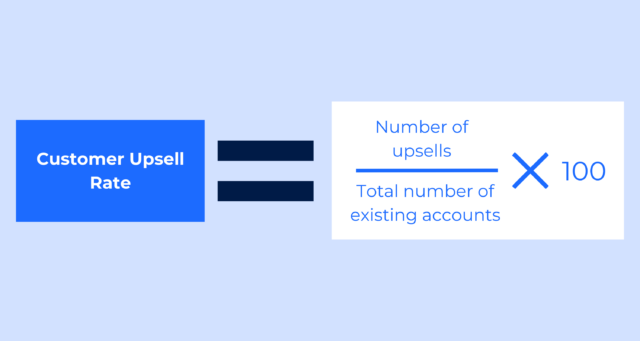
A high upsell rate indicates that your existing customers find value in additional products or services. If upsell rates are low, you might create targeted campaigns highlighting the benefits of complementary products to existing customers.
Your cross-sell rate measures the rate at which existing accounts purchase complementary products or services. This metric indicates the effectiveness of your cross-selling strategies and can help optimize your product bundling and promotional efforts.

Successful cross-selling can significantly increase revenue from existing customers. Low cross-sell rates may prompt a reassessment of your product bundling strategies or creating joint promotional offers to encourage cross-purchases.
Net revenue retention (NRR) provides a comprehensive view of growth from existing customers, including upsells and cross-sells, over a set period of time. This metric measures the percentage of recurring revenue retained from existing accounts, highlighting the effectiveness of your retention and customer expansion strategies.
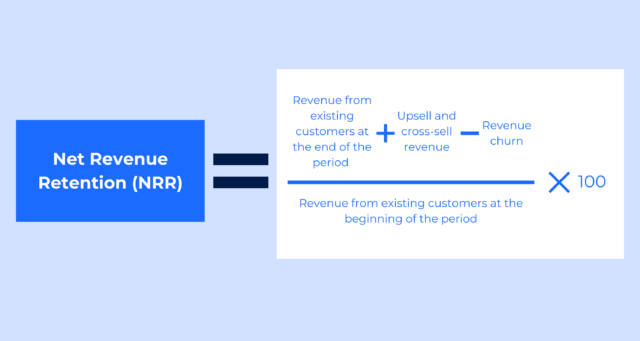
A high NRR indicates strong customer loyalty and effective upsell & cross-sell strategies. If NRR is lower than expected, you need to analyze the reasons behind churn and upsell & cross-sell performance to identify areas for improvement in your customer retention and expansion strategies.
Measuring the effectiveness of your ABM strategy is crucial for ensuring that your marketing efforts align with your business goals and delivering the desired results. Here are key tools, technologies, and strategies to help you track and analyze your ABM KPIs and metrics effectively.
Your CRM system is essential for tracking interactions with target accounts and managing pipeline data. A robust CRM system provides a centralized location for all account information, making monitoring KPIs and metrics such as engagement, pipeline creation, and conversion rates easier. CRM systems offer a comprehensive view of cross-channel program performance and account engagement when connected with marketing automation tools, allowing for more informed decision-making and strategy adjustments.
Marketing automation tools help automate and track marketing activities, including email campaigns, content downloads, and website visits. These platforms can integrate with your CRM to provide a holistic view of account interactions and engagement. Leading marketing automation tools enable you to leverage intent signals and campaign performance to inform target account scoring models and measure the impact of your campaigns on pipeline and revenue through their integration with CRM systems, ensuring that your ABM efforts are effectively driving business outcomes.
Dedicated ABM platforms are designed to manage and optimize account-based marketing strategies. These platforms provide advanced analytics and reporting capabilities, allowing you to track the performance of your ABM campaigns in real-time. ABM platforms can connect with CRM systems and marketing automation tools, providing a seamless flow of data that enhances visibility into account engagement and program performance. They help identify high-value accounts, measure engagement across multiple channels, and assess the overall impact on pipeline and revenue.
Creating dashboards for tracking your ABM KPIs and metrics in real time allows for continuous monitoring and quick adjustments. Dashboards should be designed to provide at-a-glance views of critical metrics and trends. Here are some best practices:
Analyzing your ABM data is essential for turning raw metrics into actionable insights. Here’s how to approach this analysis:
Optimizing your ABM KPIs involves continuously monitoring, analyzing, and adjusting your strategies to ensure they align with your business goals and deliver the desired results. Here are some best practices to help you optimize your ABM KPIs effectively.
To ensure your ABM strategy remains effective, reviewing and adjusting your KPIs regularly is crucial. Most organizations will aim for a 28-day overview, but oftentimes will review on a monthly, quarterly, and yearly cadence. This process involves:
An effective ABM strategy requires close collaboration between sales and marketing teams. Creating feedback loops ensures that both teams are aligned and can share insights that help optimize ABM efforts.
Leveraging advanced analytics can provide deeper insights into your ABM performance and help optimize your strategies.
Understanding and optimizing ABM KPIs is crucial for driving success in your account-based marketing efforts. You can gain valuable insights into your ABM strategy’s effectiveness by tracking essential KPIs like market reach, account engagement, pipeline velocity, and retention rate. Leveraging CRM systems, marketing automation tools, and ABM platforms help in accurate tracking and analysis, while regular reviews and advanced analytics optimize performance.
But all that tracking is for nothing if you don’t find opportunities to be more proactive with your data. To take your ABM strategy to the next level, explore ways to optimize key ABM campaigns, such as following a customer expansion blueprint, and case studies showcasing winning approaches to an effective ABM strategy. Continuously learning and adapting ensures your ABM efforts deliver significant business results and maintain alignment with your overall objectives.
Ready to elevate your ABM strategy? Contact us to meet with an expert in account-based marketing campaigns and learn more about how Madison Logic can help you quickly identify the ABM KPIs that matter to your business.